How Much Time Do We Spend on Social Media Per Day?
What daily social media figures actually measure, why they vary so much between sources, and why the number matters less than what the time is spent doing.
On this page
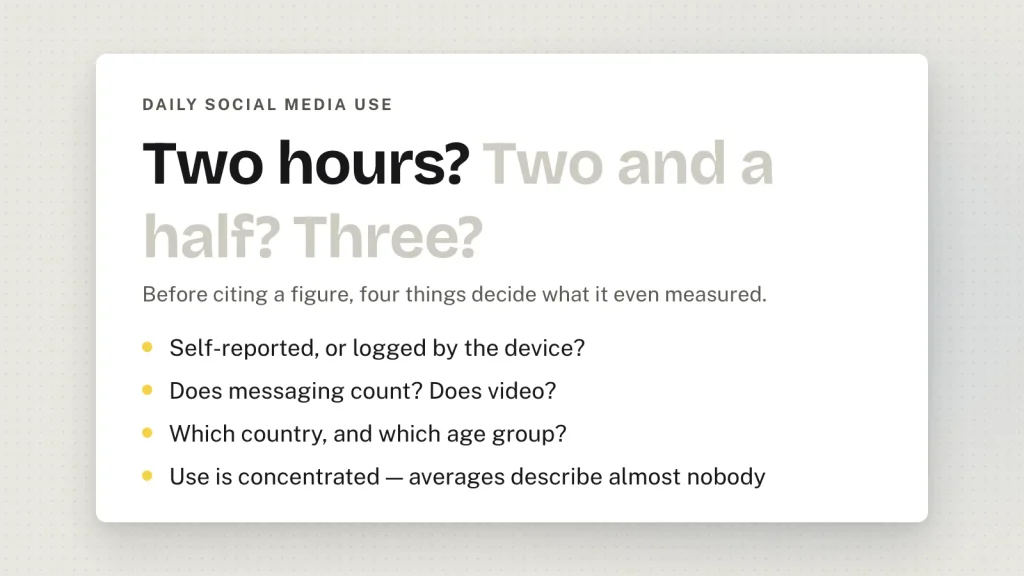
Every few months a figure circulates — two hours a day, two and a half, nearly three — and gets repeated as though it were a measurement. It is worth understanding what those numbers are before building anything on them, because the honest answer to “how much time do we spend on social media” is “it depends on four things, and most reported figures do not say which.”
Why the figures disagree
Self-reported versus measured
Most widely-quoted numbers come from surveys, and people are poor at estimating their own screen time. When researchers compare what people say against what their devices log, the two diverge substantially — in both directions, and not randomly: heavy users tend to underestimate, light users tend to overestimate.
If a figure does not say whether it was self-reported or logged, it is not comparable with one that does.
What counts as “social media”
Does WhatsApp count? It is a messaging app that most device-level studies file under social. Does YouTube? Does a news feed inside another app? Two studies can differ by an hour on definition alone.
Which population
A global average blends countries with very different infrastructure, age profiles and platform mixes. A figure for teenagers in one country tells you almost nothing about adults in another.
Active versus background
Logged device time counts an app being open. It does not know whether anyone was looking. A phone unlocked on a desk for forty minutes can register as forty minutes of use.
What can be said with reasonable confidence
- Daily use for most adults in connected countries sits in the low hours, not minutes and not most of the waking day.
- Younger people use more than older people, consistently, everywhere.
- Use is concentrated: a minority accounts for a large share of total time, which means averages describe almost nobody.
- Messaging accounts for a substantial part of the total — and messaging is the kind of use that tracks better, not worse, outcomes.
That last point undercuts most of what the headline number is used to argue.
Why the number is the wrong question
Screen-time totals persist because they are easy to collect and easy to put in a headline. They are poor at predicting anything.
The distinction that does predict outcomes is what the time was spent doing. Passive consumption — scrolling, comparing, watching — tracks worse wellbeing than active use, meaning conversation with people you actually know. Two teenagers with an identical two hours can have entirely different experiences.
A rule built on hours treats those two the same. A rule built on what they were doing does not, and is harder to write, which is why nobody writes it.
If you are measuring it for a reason
Three questions that beat a total:
- How much of it was conversation? Messaging a friend and scrolling a feed are different activities that one number merges.
- How much was after bedtime? Displaced sleep is the most actionable harm and the easiest to change.
- How did they feel afterwards? Crude, subjective, and more predictive than the duration.
Teaching this without a statistic
If you are covering this with a class, the best exercise does not involve a figure at all.
Ask students to estimate their own daily use. Write the guesses down. Then have them check their phone’s own screen-time report. The gap between the two is the lesson, and it is theirs rather than a number from a slide they have no reason to trust.
From there, the useful follow-up is sorting the time rather than totalling it: how much was talking to someone, how much was watching strangers, how much was after midnight. Mockups help you build the examples to discuss — a chat thread running past 1am, or the same post as it looks to someone having a good day and a bad one — without putting a real account on screen.
Where to find a figure you can cite
If you need a number for a report, take it from a named source with a stated method and a stated population, and quote all three. “About two hours a day” with no source attached is not a fact; it is a shape people remember.
We have deliberately not invented one for this page. A made-up statistic on a page about why statistics get misquoted would be a poor joke.
Related: effects on mental health, the other side of the ledger, and eight classroom exercises.